Category Archives: the web is a visual medium

Yet Another Example of How Not To Use The Internet To Conduct Research

(edit, April 6, 2011: Over a year since I posted this, and I just took another Zogby poll (now an “Ibope Zogby poll,” by the way), and they’re still asking this question the same way. And I still, despite being pretty politically aware, knowing my congressman’s name, and having even written the guy and gotten a response on at least one occasion, have absolutely no idea what district number I live in. Everything below this parenthetical addition is old content, so if you have seen it before, sorry.)

This is from a couple of weeks ago, and I’m just now getting a chance to post it.

88% of Americans live in a state with fewer than 53 US congressional districts in it. Only California has that many; Texas comes in second with 32.

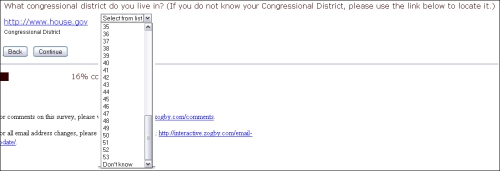
And yet, here’s how the good folks at Zogby Interactive ask what congressional district you live in:

That’s right. Zogby asks what state you live in, and then asks you, regardless of how many districts your state contains, which of 53 districts you live in. This is terrible for a lot of reasons, beginning with what should be obvious to everyone: it’s really lazy.

Looking at this from a practical political standpoint, though, it’s a mess. Folks just don’t think about their congressional district that way. Many (certainly not all) will know the name of their representative — or at least be able to pick the name from a short list of possibilities — but the odds of them knowing the actual district number aren’t great.

That being said: it can be problematic to ask people who their representative is if you’re then going to ask them if they’re going to vote for that person — it creates a priming effect and reminds (or informs, if the respondent is less focused on politics) of incumbency and makes it difficult to do a clean “would you vote for x or y” question. While I didn’t get that question as a follow-up, it’s possible some respondents did, though I somewhat doubt it this far out.

A much better way to ask this question is to ask for zip code, which will let you look up the right district in most cases; a simpler method (for the respondent), and one that might feel less personally intrusive, is to remember that this is the internet and present a state map, on which the respondent can zoom in and actually CLICK WHERE HE LIVES.

And, saying what should be obvious, but maybe isn’t: if you structure your research in such a way that only the very very very top-most super-engaged respondents are qualified to answer a follow-up, your results are only going to reflect that tiny slice of the population.

Pathetic, and sadly, about what one would expect.

Leave a comment

Filed under abject stupidity, bad user experiences, databases are your friend, election polling, Market Research, Politics, quality of responses, the web is a visual medium, Zogby

How Not To Link

This has nothing to do with research, and I’ve probably complained about this before, but it really aggravates me every time I see it:

THAT IS NOT HOW THE INTERNET WORKS, NEW YORK TIMES. CUT IT OUT.

Possibly not obvious from the screengrab, especially because the arrow gets left out: if you click the URL in the story, you go to a New York Times page that uselessly lists all their articles about Facebook. Just in case anyone from the world of old media is reading this and wants to know what they should have done: LINK TO MS. SALAHI’S FACEBOOK PAGE.

God, how is this still so difficult?

Leave a comment

Filed under abject stupidity, bad user experiences, New York Times, non-research, the web is a visual medium

Blank = Zero

Can we please just all agree that blank = zero?

Greenfield, unsurprisingly:

blankiszero

Come on, guys. Stop making things hard for respondents. It’s not like you have enough of them to begin with.

3 Comments

Filed under answer choices, bad user experiences, Market Research, the web is a visual medium, web research

Zogby Motorcycle Emptiness

What fresh hell is this? John Zogby has discovered the matrix? And somehow made it uglier than any other matrix in the history of research? All true, and more on that in a moment, but first, this unusual use of the ticky box:

zogby motorcycles

That’s probably illegible unless you click on it, but the gist is I’m being asked, in a pretty wordy fashion at that, which of the following things I’m interested in or knowledgeable about; nothing inherently wrong with that setup, except this: I’m then given exactly one box to check (or not check, as the case may be) : “motorcycles.”

Let’s type it out and count, OK?

John’s Way: (53 words)

“Now for some questions about consumer goods categories. Please choose the categories in which you feel you have a particular interest and knowledge. This means you actively seek out information on these products and services (for example you watch TV shows/read magazines and websites/attend exhibitions/discuss with friends and colleagues etc.)

My Way: (6 words)

“How interested are you in motorcycles?”

Now, it’s possible the reason I only saw the single checkbox for motorcycles is because my answers to the previous series of questions disqualified me from everything else, although I don’t really think my responses would have pointed in the direction of motorcycles,  but who am I to judge? Anyway, as promised, here’s what the first screen of these looked like:

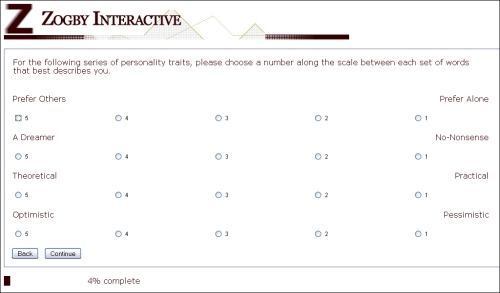
zogby matrix

Maybe I shouldn’t say this is uglier than any other matrix — maybe it’s just that it’s simpler, in that it uses less newfangled HTML and is therefore, I don’t know, easier to access via mobile browsers, which isn’t a bad design goal to have — it’s just very strange looking to me, and pretty hard to take in at a glance. By the time you get down to the last button on the right, it’s not immediately obvious to me if that “1” radio button is for “Pessimistic” or for some other word that I perhaps need to scroll down for, or that’s just not appearing for some reason.

Are mobile/degraded browsers a big factor in the panel research industry? Are there a lot of folks on the Greenfield panel using Netscape 2.0 on Mac IIci’s or something? Because I seriously don’t get why this hasn’t all been replaced — and I’m talking about everyone here, not just Zogby — with some well-designed Flash code. Seems to me a freshman design student could pretty quickly mock up something vastly superior to anything being used in the industry today, no?

One other thing I found interesting: on some (but not all) screens of this survey, when I clicked the final radio button, I was automatically advanced to the next page. Despite the pages having a “continue” button on them, by the way. I don’t have a problem with auto-advancing in general, though I think it needs to either consistently happen 100% of the time or 0% of the time — but I’m curious what y’all think about it. Is the auto-advance, which would make it difficult or impossible to go back and fix an error you made, a good thing or a bad thing?

8 Comments

Filed under answer choices, bad user experiences, Market Research, matrixes make me cry, the web is a visual medium, web research, Zogby

Whoa, Two Months?

Crap, I know I’ve been busy, but this is ridiculous.

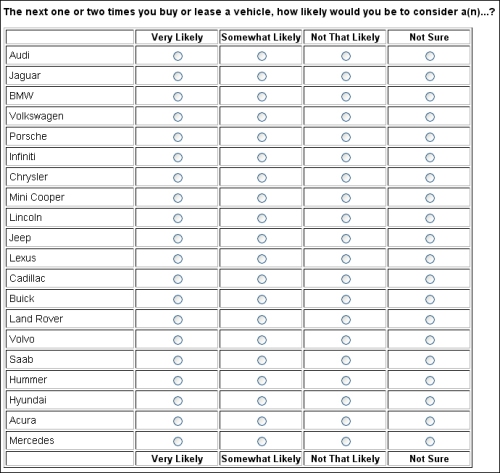
Still fighting the good fight, but haven’t had time to write about (or even look at) much research lately. I did catch this grid a couple days ago, and I think it’s worth throwing up and looking at, not because it’s a particularly terrible example (it’s sadly just typical), but because I can imagine so many better ways to measure this:

harris vehicle grid

Can’t you picture something with different carmaker logos (or, maybe even better, images of their most popular models) that you can drag up and down or left and right to indicate exactly how likely you would be to consider each of them? And that’s just my very first thought on this one.

Flash makes pretty much anything possible, but we’re still using virtual #2 pencils to fill in virtual scantron bubbles, aren’t we? What do you think?

8 Comments

Filed under Harris, Market Research, matrixes make me cry, open questions, the web is a visual medium, web research

Also Not About Research: Why Can’t Newspapers Figure The Internet Out?

Looks like I’m adding a couple hundred more words to the millions already written this year about Why The Media is Dying. This screencap from a New York Times article today about famous people hiring people to “ghost twitter” for them:

nytfail

You’d think those links (or, as I’m sure they call them at the Times, hyperlinks), which appear throughout the story for just about ever well-known person they mention, would go to the corresponding Twitter accounts, right?

Of course they don’t. They go to pages the Times has built that contain links to all the other NYT stories about those people. (And, hilariously, both Obama links go to the same place.)

How can they possibly be this bad at the internet?

There is, as always, a lesson for researchers mixed in: there’s no point using new technology if you ignore the advantages it gives you. Don’t make people re-enter demographic information that’s already in your database; don’t make people select their state from a pull-down menu when you could just let them click on a map. Don’t make people hit a “submit” button when you could just auto-advance once they click their response. Recognize that Flash is pretty much universal by now and there’s really no reason not to take advantage of what it can do.

Don’t be a newspaper.

5 Comments

Filed under bad user experiences, social media, the web is a visual medium

THIS IS INTERESTING

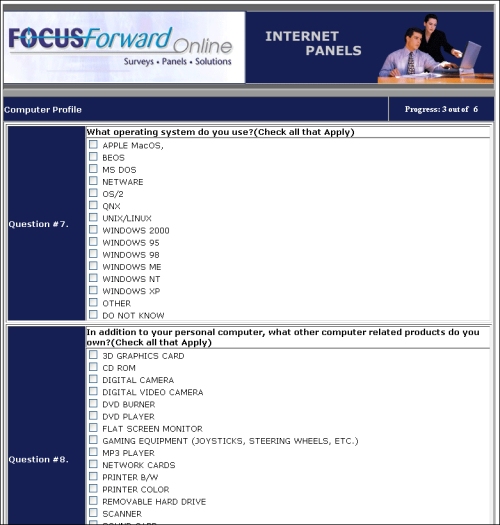
I’m not sure what’s more interesting about this: the ALL CAPS FOR NO APPARENT REASON, or the inclusion of every operating system known to man:

focus2

Odd they left out CP/M. I wonder how many OS2 users they still get.

They get bonus points for the odd clip art, too.  “Look at this fascinating INTERNET PANEL question I’m being asked, Hilda!”

3 Comments

Filed under answer choices, bad user experiences, Market Research, the web is a visual medium, web research

Pssssst: It’s Still a Matrix

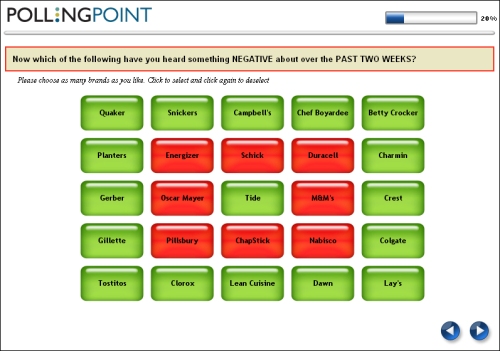
Even though I can make cool patterns with it, it’s still a matrix, and in the end, it’s still a bit boring.

polling-point-matrix

I still think this is an innovative approach, and one with promise — but I think it would be much stronger with logos or product images in place of the text. Take advantage of the unique opportunities you get in web-based research.

4 Comments

Filed under matrixes make me cry, Polling Point, the web is a visual medium

Really?

Seriously?

Aside from the part where the question is inherently creepy (until you get to the next question and realize you’re about to be asked how much beer you drink each week), was a text field — a text field in which the user has to insert slashes, no less — really the best way to capture this particular piece of data? This beats pull-down menus how, exactly?

Leave a comment

Filed under the web is a visual medium

If you’re going to use the web, USE THE WEB.

Why is everyone still doing this?

Yes, when you report research results to your client, you’re going to want to group the responses into age groupings. Makes sense.

Why, though, are you asking your respondents to enter their answer using those same groupings? Three real issues I have with this approach:

1) When I see groups, I immediately think that some of the groups will qualify to continue, and others won’t. I want that $2, or that sweepstakes entry, or, frankly, I want to kill fifteen minutes; I don’t want to get told I don’t qualify. Therefore, I’m not telling it I’m in the lowest group or the oldest group, and really, probably not the next ones in, either. I’m playing it safe and saying I’m 30-59; that’s probably the safe range.

2) Down the road, if the client wants to see the data broken out in different ways — let’s say the client comes back and asks to see the 25-54 year-olds broken out — there’s no way to provide that data.

3) Why limit yourself to nothing but radio buttons? It’s not difficult to program a text-entry field that’s limited to accepting only digits; it’s not especially difficult to program a slider that lets respondents navigate to their exact age or year of birth, either.

4) Yes, I said three real issues; this is the bonus, fourth issue. This isn’t RDD research — this is web panel work. The panel company already knows my age, as well as my gender, my race, my current mode of internet connectivity, and a thousand other things. Why can’t it use that stored data to fill in the correct responses to these questions without ever even showing them to me? Yes, that requires a lot more work — that’s why I consider this a “bonus” item — but the panel company that figures out how to do this reliably and consistently will reap the benefits of significantly shorter surveys — especially on the qualifications end. Greenfield is particularly bad about this, asking me the same five or ten initial questions before every piece of research and then telling me I’m not qualified for it — so why did they present it to me in the first place?

Leave a comment

Filed under databases are your friend, the web is a visual medium, thinking ahead for client needs