Category Archives: data quality

Taking a Hatchet to Your Matrix

Not a newsflash: I hate matrixes. That being said, I acknowledge they’re sometimes going to be necessary. If you’ve got to use one, though, I think it’s in everyone’s interest to keep each one as small as possible, and to use as few of them as possible.

There’s often a point in web surveys where the respondent is asked whether or not he has heard of a number of different items – brands of orange juice, for instance, to use my favorite example. That’s followed by another question asking which of the brands the respondent has personally tried.

Then come the matrixes, where respondents are asked to rate each of the brands that they’ve heard of – not just the subset they’ve personally tried – across a number of rating criteria, each one likely being its own matrix on its own page. This is the point where the respondent suddenly regrets being so honest about the brands he’s seen in the grocery store or advertised on TV, because he suddenly realizes he’s going to be spending the next fifteen minutes of his life clicking “don’t know” or “not applicable” on matrix after matrix inquiring about the best flavor, the least pulp, the nicest packaging, and so on. I get, very clearly, that as researchers, this isn’t entirely a waste of time – we can give our clients a report that shows the attitudes crosstabbed by both active users and those who are just aware of each brand. It has the added “bonus” of letting us inflate the number of respondents — you get to tell your client that you asked the evaluation questions of significantly more people than you would have if you’d only included those who use the brands in question. (This is the product research version of asking unlikely voters how they’ll be voting.) And, of course, it’s possible that some respondents will have differing levels of familiarity with the products they don’t themselves use, and may actually be able to provide useful feedback nevertheless. But, still:

I’m writing this, actually, as I take a break from a piece of research I’m in the middle of taking. I think I’m on about the sixth matrix page. I’ve got 8 columns going across – 7 point Likert plus a “not sure” – and 10 rows of brands going down, only 1 of which is asking me about something I truly have knowledge of – the other 9 are things I’ve heard of, but have no ability to evaluate. I don’t want to go into specifics, but let’s pretend it’s about travel, and that it first asked me which foreign cities I’d ever considered traveling to, and then asked which ones I’d actually visited — and now it’s asking me about every city I’d considered going to, to rate the quality of its museums, central train station, hotels, safety, and so on. There might be the occasional question I can answer based on something a friend told me or based on something I vaguely remember reading on Wikipedia or in a Rough Guide, but in general, I’m just not able to comment on the friendliness of the Dublin populace, you know?

Not only is this frustrating, but I’m also (and this wouldn’t apply to an ordinary respondent) acutely aware that my speeding through page after page, clicking “not sure” for 9 of the 10 choices and then assigning an answer choice to the one thing I’m familiar with is probably going to result in my responses being discarded anyway.

I have a sense, based on the level of detail each matrix has gone into, that I’m going to have another 4 or 5 of these waiting for me, and honestly, I’m hoping I time out while I write this; if I do, I’m done.

Is an aggravated respondent really in anyone’s best interest?

4 Comments

Filed under bad user experiences, data quality, Market Research, matrixes make me cry, web research

Obscure AND Potentially Personally Identifying? Let’s Ask It!

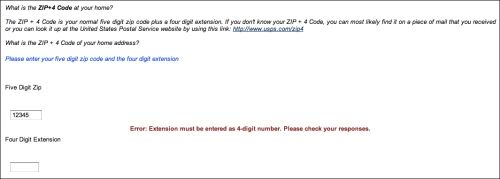
Sent in by a reader; click to embiggen:

Bad enough they’re asking for something few people would know offhand — and who wants to go fetch a piece of mail to get the answer  — but I think there’s an equally bad issue here regarding respondent confidentiality, at least theoretically.  A quick search of census data for some five-digit zip codes chosen at random from among those I’m familiar with around the country shows between about 8,500 and 16,000 occupied households in each. (I wouldn’t call that an average, as it’s practically anecdotal, but it’ll do for now, since I can’t find exactly what I’m looking for.)  A zip+4, though, is designed to be reflective of a much, much smaller geography. According to the US Postal Service:

The 4-digit add-on number identifies a geographic segment within the 5-digit delivery area, such as a city block, office building, individual high-volume receiver of mail, or any other unit that would aid efficient mail sorting and delivery

How small are those “geographic segments?” You can use this USPS lookup tool to get a sense of it. I live on a suburban street; my house is on a corner. My immediate neighbor around the corner has a different zip+4; the people across the street have a different zip+4; the house immediately behind me has a different zip +4. The house next door to me, though, and the two houses that follow it going down to the end of the block — those all have the same zip+4 data. Apparently, my personal zip+4 will narrow you down to one of four homes.

Now, presumably, you gave your full mailing address when you signed up for this panel, so it’s not as if the research company) doesn’t already know exactly who you are and where you live — and it’s not as if telephone research doesn’t contain your even more personally identifiable phone number right there in the data — but still, this makes me uncomfortable. Rather than using back-end databases to append that information in post-production (which, for the millionth time, would be the ideal way to deal with this situation), we’re instead outright asking for something that both makes your data pretty easy to tie back to you and which you don’t know in the first place. (I actually thought I knew mine, and I don’t, though I was fairly close.)

All in all, this strikes me as a really bad question. What do you think?

3 Comments

Filed under bad user experiences, data quality, databases are your friend, ethics, Market Research, redundant questions, web research

No Way Do Two Thirds of Americans Have HDTV. No Way.

Sorry, but I’m willing to bet this piece of research is completely wrong. I’d want to see the actual questionnaire, but here’s what I’ll assume until then:

Many, many, many people have no idea whether or not they have HDTV. Two main reasons:

  1. There is a serious lack of understanding among non-techie respondents about the terms “digital,” “high definition,” and “HDTV.” I’ll bet $20 that at least 20% of the population thinks they have HDTV because they bought a $40 conversion box for the digital transition.
  2. Because for years now, everything from network dramas to local newscasts has been opening with an onscreen logo that says something like “in HD where available,” or “presented in HD,” just like they used to do the exact same thing for stereo … only now they’ve also gone and incorporated it right into their station logos.

That’s right. Viewers with old 4×3 standard definition TV sets are constantly shown on-screen graphics that, in combination with the fact they bought conversion boxes, has them convinced they’re watching HDTV:

“Of course I have HDTV! It says HDTV right there on the screen!”

It’s difficult to research a topic when respondent confusion is this widespread. It’s not completely impossible, but it’s really, really hard. I can think of a couple of ways to try to do it, but they’re so cumbersome (as in, “look behind your TV and tell me the model number”) that they’re just not going to work.

Oh, and let’s not forget that there’s also God-only-knows how many people — this would include many of our parents, I’ll wager — who have HDTV sets but are watching standard definition broadcasts on them.

16 Comments

Filed under data quality, Market Research, TV

Just Say No Already.

Annie Pettit this morning tweeted from the Net Gain 4.0 Conference in Toronto:

Clients still want 1 hour surveys and we can’t do anything about it : I say turn it down!!

I’ll go further than that: I say turn it down and make it clear to the client that they are the cancer that is killing market research. What in the world can you learn from a sixty minute survey that you can’t learn from a 5-minute one? (I’m not talking about an in-depth qualitative research project, or something where you hook someone up to an EEG and have them watch an episode of CSI: Miami to see what their brain has to say. I’m talking about asking questions, on the phone or on a screen. 60 minutes is 55 minutes too long!

Do we really think the respondents still on the phone (or on the web) at the one-minute mark, the ten-minute mark, and the 60-minute mark are identical?

4 Comments

Filed under bad user experiences, data quality, Market Research, matrixes make me cry, The cancer that is killing market research, web research

Straightlining vs. Answering Your Stupid Question Honestly

OK, this is something I hadn’t thought of before.

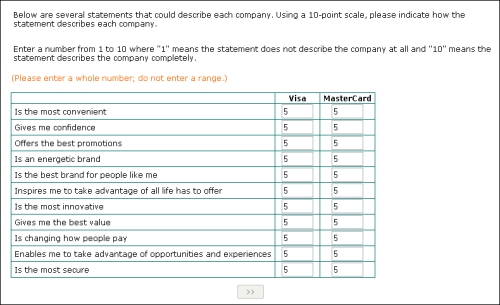
When I’m staring at a bad survey question — asking me to compare two absolutely identical companies in a matrix, for instance — my tendency is to do this:
straightline

They’re equal. There’s no difference between Visa and MasterCard in my mind. Discover and American Express, those are different, both from one another and from these two brands, but Visa and MasterCard might as well just merge, as far as I’m concerned. Of course, there’s no way to provide that answer in the framework provided here, so I decided to simply give each company a score of “5” for each item. That seemed to get the message across, as far as I was concerned. Of course, as soon as I clicked the button, I got booted, with the same generic non-qualified message you get when you tell them you don’t have kids or haven’t seen a movie in the past two months or whatever it is. We all know the truth: they booted me for straightlining.

Which I wasn’t.

At the very least, wouldn’t it be smarter to keep me in and see what the rest of my answers looked like? With the amount of amply-documented badly designed questionnaires out there, shouldn’t we maybe consider that a respondent will occasionally need to do something to get around a poorly framed question, or an item that simply doesn’t apply to them?

Simply ending the survey as soon as someone gives all items on a page the same value seems both too simplistic and too drastic a solution to me.

5 Comments

Filed under answer choices, bad user experiences, data quality, Greenfield, Market Research, matrixes make me cry, web research