Category Archives: quality of responses

Yet Another Example of How Not To Use The Internet To Conduct Research

(edit, April 6, 2011: Over a year since I posted this, and I just took another Zogby poll (now an “Ibope Zogby poll,” by the way), and they’re still asking this question the same way. And I still, despite being pretty politically aware, knowing my congressman’s name, and having even written the guy and gotten a response on at least one occasion, have absolutely no idea what district number I live in. Everything below this parenthetical addition is old content, so if you have seen it before, sorry.)

This is from a couple of weeks ago, and I’m just now getting a chance to post it.

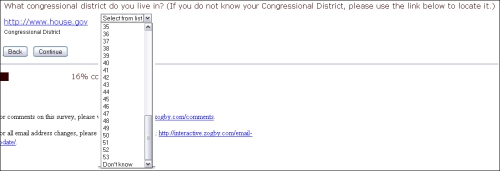
88% of Americans live in a state with fewer than 53 US congressional districts in it. Only California has that many; Texas comes in second with 32.

And yet, here’s how the good folks at Zogby Interactive ask what congressional district you live in:

That’s right. Zogby asks what state you live in, and then asks you, regardless of how many districts your state contains, which of 53 districts you live in. This is terrible for a lot of reasons, beginning with what should be obvious to everyone: it’s really lazy.

Looking at this from a practical political standpoint, though, it’s a mess. Folks just don’t think about their congressional district that way. Many (certainly not all) will know the name of their representative — or at least be able to pick the name from a short list of possibilities — but the odds of them knowing the actual district number aren’t great.

That being said: it can be problematic to ask people who their representative is if you’re then going to ask them if they’re going to vote for that person — it creates a priming effect and reminds (or informs, if the respondent is less focused on politics) of incumbency and makes it difficult to do a clean “would you vote for x or y” question. While I didn’t get that question as a follow-up, it’s possible some respondents did, though I somewhat doubt it this far out.

A much better way to ask this question is to ask for zip code, which will let you look up the right district in most cases; a simpler method (for the respondent), and one that might feel less personally intrusive, is to remember that this is the internet and present a state map, on which the respondent can zoom in and actually CLICK WHERE HE LIVES.

And, saying what should be obvious, but maybe isn’t: if you structure your research in such a way that only the very very very top-most super-engaged respondents are qualified to answer a follow-up, your results are only going to reflect that tiny slice of the population.

Pathetic, and sadly, about what one would expect.

Leave a comment

Filed under abject stupidity, bad user experiences, databases are your friend, election polling, Market Research, Politics, quality of responses, the web is a visual medium, Zogby

Joel on Research and the Paradox of Choice

Joel Spolsky runs a software company and writes a blog called Joel on Software, but I often find what he writes is applicable to business in general, and occasionally to the research world as well. Recently, in his Inc.com magazine column, he wrote about the problems that develop when too many people are involved in a decision making process — in this particular case, he mentions how a former Microsoft developer tells how designing the Windows Vista shutdown menu took something like 43 people something like a full year and produced a menu with nine near-identical options. The developer calls it The Windows Shutdown Crapfest. The lesson there is obvious — too many cooks spoil the soup — and relevant, I think, to our work, with plain-as-day solutions — trim your meeting invite list and get extra hands out of the work — but dig a little deeper for a more important lesson.

Each of those links in the above paragraph is worth perusing, but the most worthwhile link I’ll have for you today is this, Joel’s original 2006 post on this topic, which does a great job of explaining the resulting mess in terms we all should be able to understand:

The fact that you have to choose between nine different ways of turning off your computer every time just on the start menu, not to mention the choice of hitting the physical on/off button or closing the laptop lid, produces just a little bit of unhappiness every time.

How do we expect our respondents feel when we ask them to tell us if they are Extremely Satisfied, Very Satisfied, Somewhat Satisfied, Neither Satisfied Nor Satisfied, Somewhat Unsatisfied, Very Unsatisfied, or Extremely Unsatisfied with something? What about when we ask them that about a whole page worth of somethings? And what about when some percentage of the questions — anywhere from 1/8 to 1/4 in my rough estimate — don’t apply to the respondent at all? I’d argue we create more than “just a little bit of unhappiness every time.”

The lesson is the same as it so often is here: keep it simple. Satisfied/Unsatisfied/Not Sure should be perfectly sufficient in mot cases, and has the advantage of making the results much more comprehensible at a glance. When comparing results across multiple questions, or across a wide time line of tracking data, it’s infinitely easier to comprehend a single number. The presidential approval number is generally reported as a single figure: 55% in this poll, 48% in this other poll, 53% a month ago, 58% today, etc. Instantly understandable by everyone, as opposed to something like this:

Today, 23% strongly approve of the President’s job performance; 27% say they somewhat approve. Two weeks ago, 29% strongly approved; 17% somewhat approved.

How do you parse that? Strong approval is up down 6 points at the same time that mild approval is up 10 points; overall, if you add the “strong” and “somewhat” numbers together, you can see that overall approval is up four points, but what do you do with those shifts in the gradated responses? Well, if you’re the nightly news — and I’m not suggesting that’s who we should be emulating, necessarily — but if you’re the nightly news, you ignore it and report it as a four point climb. (Well, depending on your viewpoint, you might say the nightly news would be most likely to point out the six point drop in “one measure of the President’s approval rating” and leave it at that, and I don’t think you’d necessarily be wrong about that observation, so.) If you’d only asked the question as approve/disapprove, though, you’d give respondents a simpler experience, and you’d give those interpreting the results both an easier time of it and less wiggle room for those with an agenda.

Let’s see what happens if we offer fewer choices. You really don’t need nine ways to turn off the computer, or seven ways to tell us how satisfied or unsatisfied you are. Honest.

4 Comments

Filed under answer choices, bad user experiences, Market Research, quality of responses

How Many Yards Do You Commute To Work, And Other Badly-Measured Intervals.

I’m really sorry I’ve been so dormant lately.  I don’t really have an excuse, other than that I’ve been busy enough with other things that I haven’t been taking many online surveys, and as a result, I haven’t had anything to post.

Today, though, that changes. Hopefully for good? We’ll see.

So I watched an episode of How I Met Your Mother at cbs.com just now, and following it, they gave me a survey from Magid about my use of streaming video, peer-to-peer sharing, and so on. I’ve actually been getting a lot of TV via the internet lately — there’s just too much on at the same time on Thursdays, and I’ve been forced to torrent or use Hulu to watch at least some of it, since my DVR can only do two things at a time, and there seem to be THREE things on simultaneously from 8:00 to 10:00 those nights. Some weeks I grab torrents, others I use Hulu — it mostly depends on when I’ll be watching, because I have kids, and I find it much easier to watch TV with closed captions when they’re around, since they’re noisy little things. If I’ll be watching when they’re home, I often use Hulu; if they’re out or asleep, I’ll often get the torrents, which are usually better quality, and are usually able to be streamed to my TV, too.

Anyway, the point here is to share this incredibly ill-conceived question, which was the one really badly thought-out item in an otherwise pretty solid survey:

quarter hour

Really? You want me to think about how much TV I watch in 15-minute increments? Why on earth would you think this was the right way to ask this question? I had to do MATH to answer the question, counting up the number of hours of TV I watch and multiplying by 4, which might not even be an obvious option to every respondent. The strangest thing is, the 15-minute increment makes no sense in either context. Online versions of TV shows aren’t ever in 15 minute formats — half hour sitcoms run around 22 minutes, and hour dramas are around 44 — and the other things people watch online, like movie trailers and clips of people being idiots on YouTube are much shorter.

I don’t get it. Which I suppose isn’t unusual.

2 Comments

Filed under answer choices, bad user experiences, Market Research, quality of responses, web research

Is the panel research business model creating a gold farming problem?

Greenfield must be having trouble getting panelists to complete research these days. Maybe it’s the summer blahs, with respondents too hot, too sweaty, or just too on vacation to be bothered.

Then again, maybe it’s something to do with people just getting sick of trying to imagine their orange juice has come to life and is displaying personality traits.

In any case, I’m sure this is the answer:

50 cents

50 cents per survey! At 20 minutes per survey, that’s like, $1.50 an hour! This will totally solve all of Greenfield’s problems, and can only lead to amazing data quality.

Right?

But let’s turn this repetitive Greenfield mockery into a real question:  what are the odds that this sort of incentive (and incentives in general, really) has already led to or soon will lead to the market research version of “gold farming?”

Gold farming, if you don’t want to bother reading the Wikipedia entry, is an exploit carried out within massive online role-playing games, like World of Warcraft. I’m no expert in it, but as I understand it, people hire low-wage workers (this has apparently been an issue in China) to sit in front of multiple computer terminals logged into the online game. The workers don’t actually play the game as it’s intended to be used, but they instead perform repetitive actions, generally using automated scripts, to earn (or, colloquially, to farm for) in-game cash — virtual money, essentially, that can be spent on in-game items like better weapons and the like. The folks behind the operation then sell the virtual currency online, to actual players of the game who want to buy a really cool sword or whatever but who can’t be bothered spending weeks building up the in-game cash to buy it.

So, since Greenfield is paying 50 cents for 20 minutes worth of human labor here, it occurs to me that someone has probably already figured out that they write some scripts to blast through these things in (let’s say) five minutes each — 12 per hour, as opposed to 3 per hour. And that’s per computer. So you sit a guy in front of five screens, each logged in on a different Greenfield account, each earning $6 an hour — so $30 an hour across those five screens — you know, if your labor only needs to make around $3 an hour, that’s $216 a day in pure profit for the guy in charge. And that’s assuming he’s only got one guy doing this on only five accounts at once.

Now, I’m sure I can’t be the first person this sort of thing has occurred to, and I’m sure Greenfield and the other panel outfits are trying their hardest to make this impossible, limiting the number of surveys one respondent can complete in a day, maybe checking for a total elapsed time and invalidating surveys that move too quickly — but, I don’t know, that strikes me as sort of being similar to making the roads near the bars really wide and straight instead of outlawing 24-hour happy hours, or some similarly goofy comparison.

If we want honest answers from real people, maybe we should rethink this entire insulting “we’ll pay you fifty cents to answer 120 repetitive questions about the minute differences between four brands of orange juice” business model.

9 Comments

Filed under Greenfield, incentives/compensation, Market Research, quality of responses, The cancer that is killing market research, web research

Wow. Just wow.

You’ll have to excuse the low quality of the image here; I snagged it off a WebEx meeting where the presenter flashed it by as part of a PowerPoint he was sharing. I don’t know the source, I don’t know the rationale, I just know it’s probably going to be the worst matrix you ever see:

holy-god-bad-matrix

Click to see it full size. You might want to print it out and tape it up to remind you to never do this, though I suspect you wouldn’t be reading this if you would.

1 Comment

Filed under bad user experiences, Market Research, matrixes make me cry, quality of responses, The cancer that is killing market research, what

When Bad Research and Social Media Intersect

Here I am minding my own business, scrolling through my Facebook news feed on a Saturday morning, and suddenly I see this:

facebook-poll

That’s a hell of a complicated question to fling up there in-between “so-and-so added new photos” and “so-and-so is wondering if my dog’s tail wags left to right or right to left??”

I don’t think there’s an inherent problem with asking a one-off question this way, but I do think there’s a problem asking about a topic as complex as protectionism in a single question, with no build-up or explanation.

(And that’s ignoring the incredibly loaded “at this time of crisis,” which surely doesn’t belong there.)

Hmpf. This article talks a little about it and says it’s Facebook doing it, but no mention of who’s actually sponsoring it — note it says “Sponsored poll” on it, implying there’s someone somewhere who’s paying for this data. Wonder if they’ll think they got what they paid for?

3 Comments

Filed under Market Research, quality of responses, social media, web research

Stop screwing up the conversation.

You’ve probably given a lot of thought to the scales you use in your research. You’re undoubtedly aware of the advantages and disadvantages of 5-point Likert vs. 4-point Likert scales, and you’ve probably even spent time arguing with colleagues or clients over whether a 7-point or 5-point scale would produce better learning in a given situation.

Here’s the part where I piss you off and tell you I believe you’re doing it wrong:

You’re doing it wrong.

This is the thing, and it’s a theme I will never stop hammering: market research is a conversation between the researcher and the respondent. The more the interaction feels like an actual conversation to the respondent, the easier and more natural the process is. You ask a question, you get an answer. I think fairly few people would say it’s difficult or onerous or boring to hold a conversation with a friend, and yet, those are probably the very first words many would use to describe the agony of taking a typical piece of research.

So what does this have to do with scales?

Which of these is a conversation you can imagine people having in real life?

  • “Bob, I think that woman over there is very attractive. Do you strongly agree? Somewhat agree? Neither agree nor disagree? Somewhat disagree? Or strongly disagree?”
  • “Bob, on a scale of one to seven, I think that woman over there is a perfect seven.”
  • “I’d give her a 10. What do you think?”

In other words, no one in the history of the world has ever described a beautiful woman (or an attractive man, or a perfectly executed Olympic gymnastic routine) as being “a perfect 5.” Frame your questions in terms that your respondent are already familiar with, so they don’t have to constantly keep translating your strange foreign language of research-speak into English, so that they can understand it, formulate an answer, and then translate it back again into research-speak so they can give you the response you’re forcing them to choose.

tl;dr: stop screwing up the conversation.

4 Comments

Filed under answer choices, bad user experiences, Market Research, quality of responses

Greenfield Solves the Wrong Problem

So, I see Greenfield Online has gone and added a “security” question to their matrices to weed out people who pay no attention whatsoever. This, of course, is a predictable response to the somewhat misplaced industry obsession with the quality of online survey responses.

Oddly, though, they’ve gone and inserted this into a survey where I’m personally finding the questions — even in this matrix format — to be pretty interesting. For once, I’m not feeling like this is a tedious waste of my time:

greenfield_mortgage

Leave a comment

Filed under Greenfield, Market Research, matrixes make me cry, quality of responses